.svg)

Four Factors: Why Great Offense Starts with Smart Shot Selection
When basketball analyst Dean Oliver introduced Basketball on Paper, he gave coaches a framework for understanding what actually wins games: the four factors. We'll take a look at each of these in November. Shooting efficiency. Turnovers. Rebounding. Free Throws.
The first of the Four Factors is Shooting
At the top of his list is Shooting, weighted at 40% impact on team success. That should surprise nobody. The game always comes down to one question: Who has the most points. For coaches, if you track this back to the root, it's all about, Are we getting good shots and are we making them?
Traditionally, answering that question relied on a mix of box scores, memory/film review, and intuition. Coaches might glance at field goal percentage or watch game film, but connecting those dots: who took the shots, where they came from, and whether they were the right ones was a slow and manual process.
That’s exactly where SportsVisio’s Coach Mode changes the equation.
How do I use eFG%
Oliver’s preferred stat for measuring shooting efficiency is Effective Field Goal Percentage (eFG%), which adjusts for the added value of three-pointers. It’s calculated as:
(FGM + 1.5 × 3PM) ÷ FGA
Fun fact - the Celtics took 48.2 Three Pointers per game last year. That's nearly 4,000 attempts - the most ever. eFG% accounts for this.
In Coach Mode, this calculation happens automatically. Once your game video is uploaded, SportsVisio’s AI breaks down every made and missed shot, charting location and type of attempt. Coaches can quickly visualize why their eFG% looks the way it does, who's been shooting well, and whether the team is thriving from the corner three or settling for contested mid-range jumpers.
What About FG% and True Shooting %?
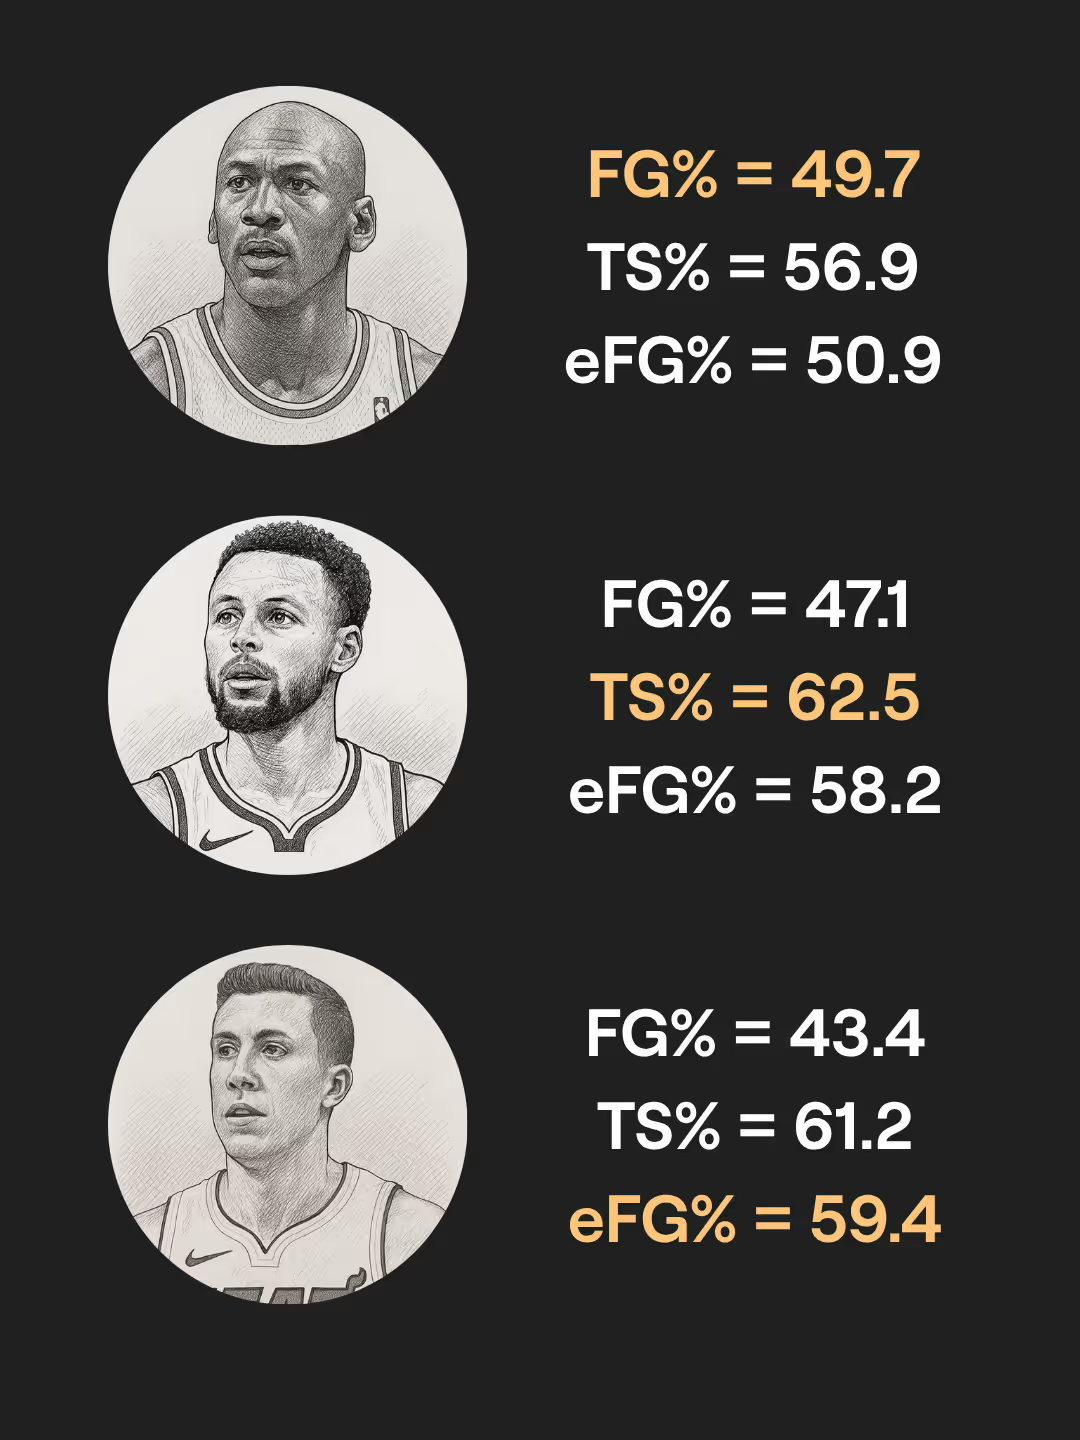
All metrics are valuable and can be insightful. Lets take a look at three different NBA players. Michael Jordan, Steph Curry, and friend of SportsVisio Duncan Robinson. Thier career stats show their very different impacts on the game. MJ had the highest FG% of three, Steph the highest TS%, and Duncan the highest eFG%. Each contributed to their teams differently, and Jordan played in a different era.
How to read a shot chart
SportsVisio goes beyond numbers by transforming them into visuals that coaches can teach from. Every made and missed shot appears on a shot chart, with a neat heat map that is color-coded by efficiency relative to the league. A coach can filter by player, period, or shot type, and Coach Mode even identifies high-value zones - the areas where your team shoots best.
Instead of telling a player they need to “take better shots,” you can show them. Pull up their heat map and point out how their FG% jumps when they attack from the right wing or cut to the rim. This level of clarity turns stats into coaching moments.

How to Turn Data Into Decisions
When you combine traditional metrics like eFG% with SportsVisio’s visual feedback through clickable shot charts and our brand new Film Room, the result is a more complete understanding of offensive performance. Here's how coaches are putting this to work right now:
- Track shooting trends over time, from early season to the playoff run
- Reinforce team identity—whether that’s paint touches, drive-and-kick, or catch-and-shoot spacing
- Identify which lineups generate the most efficient shot quality (coming soon!)
In short, Coach Mode transforms shooting from a surface-level percentage into a story of how your team scores.
The Takeaway
Dean Oliver’s first factor, shooting, matters most because it aggregates efficiency, decision-making, and shot creation in one number. With Coach Mode, that number finally comes with the why behind it.
Every coach knows great teams take great shots. SportsVisio just makes it easier to prove, teach, and repeat.
Up Next
Next week, we'll dive into why protecting possessions is the second most important factor in building a winning team.
Related Stories

.webp)
Book a Demo and Get a Free Trial
Set up time to speak with our team and see our product in action.