
.svg)
How to Understand NBA Stats: A 2026 Playoff-Era Guide
Updated May 13, 2026 (Originally published May 2025)
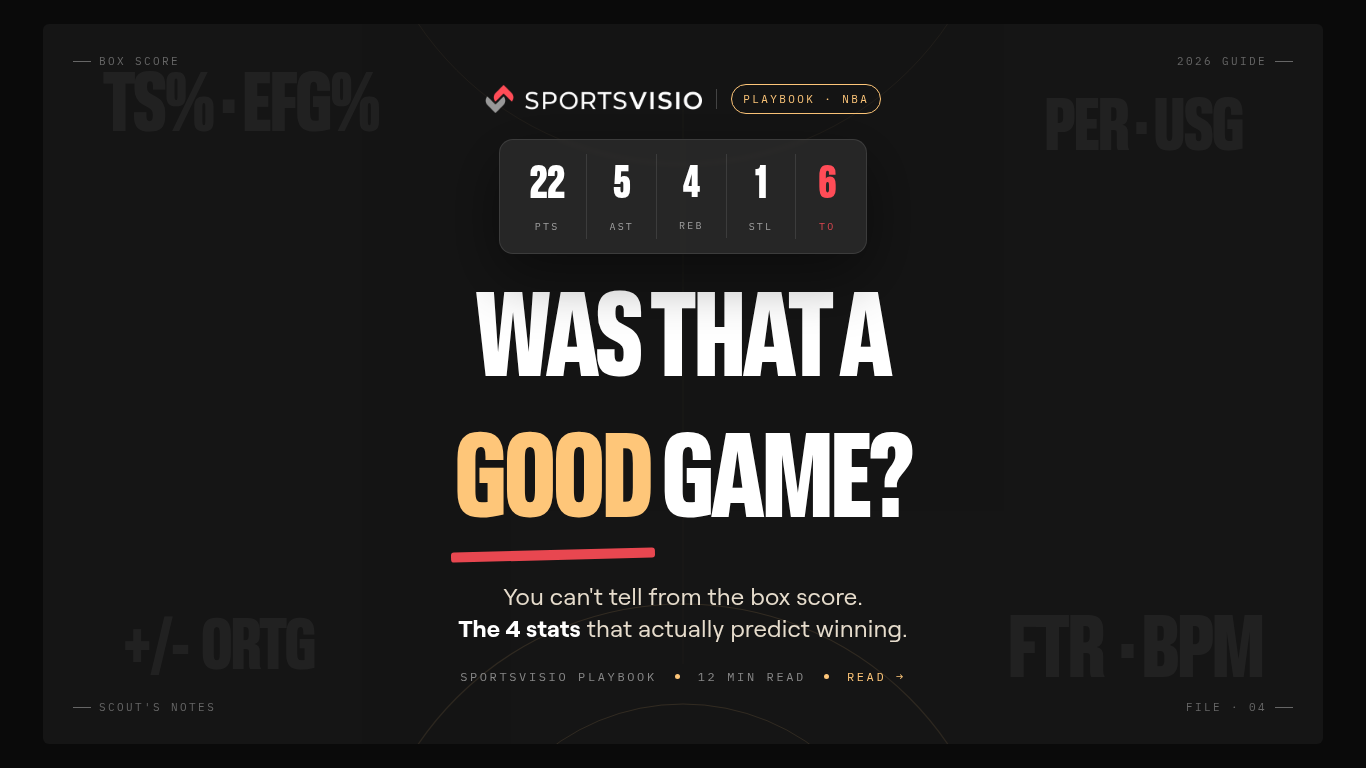
A player drops 22 points, 4 rebounds, 5 assists, 1 steal, and 6 turnovers.
Was that a good game? You can't tell. Not from the line alone.
That's the trap with NBA stats. The numbers look definitive, but most of them lie to you if you read them without context. A 25-point night on 30 shots is a worse game than 15 points on 8 shots. A +12 net rating means nothing if your bench got murdered.
The 2026 playoffs make this point in real time. Every series tells a different story depending on which stats you trust. This guide walks through the numbers that actually predict winning, in the order an NBA scout or coach would teach you to look at them.
A note from Moses Moody: "When I was getting recruited, every coach quoted my points per game. The ones I trusted were the ones who quoted my true shooting percentage and turnover rate. Those numbers told them whether I could play their system, not just whether I could score against high school defenses."
The Basics: Traditional Box-Score Metrics
Box scores display raw counting stats: Points (PTS), Rebounds (REB), Assists (AST), Steals (STL), Blocks (BLK), Turnovers (TO), and Personal Fouls (PF). Official scorers record these in-game.
These numbers are the foundation but they have a limitation built in. A player might score 25 points but take 30 shots to get there. That's not the same thing as a player who scores 25 on 15 attempts. The box score treats both lines identically.
Traditional metrics remain useful as a first read. They become misleading if you stop there.
Rate Statistics vs. Totals
Totals are time-dependent. Rate stats normalize performance so players are comparable across different roles and minutes loads.
The most useful rate stats:
- Points per game (PPG), rebounds per game (RPG), assists per game (APG)
- Assist-to-turnover ratio (AST/TO), which separates creators from hazards
- Per-36 and per-48 minute stats, which project what a player would do with starter minutes
Per-36 example: a bench player averaging 10 points in 18 minutes is on a 20 PPG pace if you extrapolate them to full minutes.
Per-possession metrics go one step further. Points per 100 possessions adjusts for pace, so fast-paced teams don't look automatically better than slow-paced teams.
Advanced Metrics: Efficiency and Impact
This is where modern NBA analysis lives.
True Shooting Percentage (TS%) accounts for two-pointers, three-pointers, and free throws in a single number. Formula: TS% = Points / (2 x (FGA + 0.44 x FTA)). TS% rewards shot selection and free-throw rate, not just shot-making.
Effective Field Goal Percentage (eFG%) adjusts for the fact that a three-pointer is worth more than a two. A 40% three-point shooter and a 60% two-point shooter have the same eFG%.
Player Efficiency Rating (PER), developed by John Hollinger, condenses a player's per-minute production into one number. League average is set at 15. PER over 20 indicates an All-Star-level season.
Usage Rate (USG%) measures the percentage of team possessions a player uses while on the floor. High-usage players carry the offense. Low-usage players play efficient supporting roles.
The headline takeaway: efficiency is now more valued in NBA analysis than raw volume. A 22-PPG scorer on average efficiency is less valuable than an 18-PPG scorer who shoots 5 percentage points higher.
Plus/Minus and On/Off Numbers
Basic Plus/Minus is the team's point differential while a player is on the court. A +10 means the team outscored opponents by 10 with that player on the floor.
The advanced versions add context:
- Box Plus/Minus (BPM): box-score-driven estimate of impact
- Real Plus/Minus (RPM): regression-based, accounts for teammate and opponent quality
- Adjusted Plus/Minus (APM): pure on/off impact stripped of teammate effects
These stats are powerful but easy to misuse. Sample size, rotation matchups, and team schemes all skew the numbers. A starter who plays only with the other four starters and racks up a great +/- looks better than a sixth man who has to anchor bench units. Use plus/minus with the context of who else was on the floor.
Team Metrics and Pace
Team-level stats translate the individual numbers to wins.
- Offensive Rating (ORTG): points scored per 100 possessions
- Defensive Rating (DRTG): points allowed per 100 possessions
- Net Rating: ORTG minus DRTG
A team with ORTG 115 and DRTG 110 has a Net Rating of +5. Sustained Net Rating over a season is the cleanest team-quality indicator in basketball.
Pace matters because high-pace teams inflate raw stats. The 2023 Sacramento Kings led the league in pace and put up huge raw offensive numbers. The efficiency metrics told a more accurate story of how good they actually were.
Contextualizing with Shot Charts and Tracking Data
Shot charts visualize where a player scores. A player shooting 40% from above the break three but only 25% from the corner three has a positioning issue, not a shooting issue.
Tracking data adds movement context: speed, distance covered, contested shot percentage, rebound chances. A player with 10 rebounds per game looks identical to another player with 10 rebounds per game in the box score. The tracking data shows whether one of them grabbed 30% of available rebounds (elite) and the other grabbed 18% (volume from being tall).
The Modern Layer: Shot Signatures
Shot charts told us where players shoot. The next step is what kind of shooter you actually are.
We pulled 59,227 shots across four leagues and grouped them into five recurring shot signatures. Every player, from your local rec-league hooper to the NBA, fits one of these archetypes more than the others:
- Three-and-Rim: high volume from beyond the arc and at the basket, almost nothing in between. The modern NBA archetype.
- Mid-Range Master: efficient inside the line, lower three-point volume. Think Kevin Durant, DeMar DeRozan.
- Paint Punisher: most shots within 5 feet, finishing volume over jump-shot polish.
- Spot-Up Specialist: high three-point share, low pull-up rate. Plays off the ball.
- Volume Slasher: drives generate shots and free throws more than catch-and-shoot looks.
The point isn't classification. The point is fit. When a team adds a player, the right question is whether that signature fits the four others on the floor. Two Mid-Range Masters in the same lineup will fight over space. Two Three-and-Rim guys spread the floor for each other.
Watch the 2026 NBA Finals through this lens and you'll see lineups built on shot-signature complementarity, not just talent.
Read the full analysis: The 5 Basketball Shot Signatures.
Common Pitfalls and Misinterpretations
The biggest trap in NBA stats is overvaluing counting numbers without adjusting for context.
A player averaging 25 PPG might be inefficient and hurt their team. Another player averaging 15 PPG on fewer shots, with better defense, contributes more to winning. The first player gets the All-Star vote. The second player wins the championship.
Additional pitfalls to watch:
- Sample size: short-term hot streaks look like emerging stars. Wait at least 20 games before trusting a trend.
- Garbage time: stats accumulated in blowouts often inflate a leader's numbers. Filter for clutch and high-leverage minutes when you can.
- Era comparison: comparing 1990 stats to 2026 stats is mostly noise. Rules, pace, and the value of the three-pointer have all changed.
The recommended approach: use pace-adjusted stats, normalize to league averages, and avoid short-term reactivity.
What NBA Players Actually Looks At
- True shooting percentage, because it's the only scoring stat that respects efficiency across all three shot types.
- Assist-to-turnover ratio, because it tells you whether a guard is a creator or a hazard.
- Defensive plus/minus on similar lineups, because raw defensive rating is a team stat dressed up as an individual stat.
- Free throw rate (FTr), because the players who get to the line are usually the players the defense can't stop.
"Box scores tell you what happened. These four tell you why."
Frequently Asked Questions About NBA Stats
What are the most important NBA stats to track?
For player evaluation, the most important NBA stats are true shooting percentage (efficiency), assist-to-turnover ratio (decision-making), usage rate (offensive load), and net rating (team impact). Traditional points-per-game is the most cited stat but the least predictive of winning. Modern analysis weighs efficiency and impact over raw volume.
What is the difference between PER and true shooting percentage?
PER (Player Efficiency Rating) is an all-in-one composite score that estimates a player's per-minute contribution across all box-score categories, normalized to a league average of 15. True shooting percentage (TS%) measures only scoring efficiency, accounting for two-pointers, three-pointers, and free throws. Use PER for total impact, TS% for shooting quality.
How accurate are AI-generated NBA stats?
AI-generated stats from computer vision systems like SportsVisio reach 95%+ accuracy on event detection (made shots, rebounds, fouls) and 90%+ on attribution at amateur and pro-am levels. NBA-grade stat tracking uses both AI systems and human verification for the official record. For coaches, leagues, and players outside the NBA, AI stat tracking is now accurate enough to replace manual scorekeeping entirely.
Why do advanced NBA stats matter more than traditional box scores?
Traditional box scores measure volume. Advanced stats measure efficiency and impact, which correlate more directly with winning. A 25-point scorer who shoots 40% is worth less than a 15-point scorer who shoots 60% on equivalent volume, but the box score makes the first player look better. Advanced stats correct this distortion.
What is a shot signature in basketball analytics?
A shot signature is a recurring shot-distribution pattern that describes the kind of scorer a player is. SportsVisio's analysis of 59,227 shots identified five common shot signatures: Three-and-Rim, Mid-Range Master, Paint Punisher, Spot-Up Specialist, and Volume Slasher. Coaches use shot signatures to build complementary lineups.
How can I track NBA-style stats for my own basketball team?
You can track NBA-style stats for any team using AI-powered stat tracking platforms like SportsVisio. The platform processes recorded game video and generates full box scores, shot charts, and advanced metrics automatically, eliminating the need for manual scorekeepers. This makes NBA-grade analytics accessible to youth, club, high school, college, and adult-league teams.
You don't need to be in the NBA to track NBA-style stats.
SportsVisio processes your game video the same way the league does: every shot, every rebound, every possession, broken down into the box score and the advanced numbers that actually matter. Record the game. We do the rest.
Related Stories

.webp)
Book a Demo and Get a Free Trial
Set up time to speak with our team and see our product in action.