.svg)
Understanding NBA Stats: A Guide by SportsVisio
Imagine you're watching an NBA game and you see a player finish with a stat line of 22 PTS, 4 REB, 5 AST, 1 STL, and 6 TO. At first glance, you're impressed by the scoring, puzzled by the turnovers, and unsure of how good the performance actually was. Was it efficient? Did it contribute to winning? And how does it compare to other players across the league? If you've ever felt lost interpreting NBA stats or wanted to go beyond the basics, you're not alone.
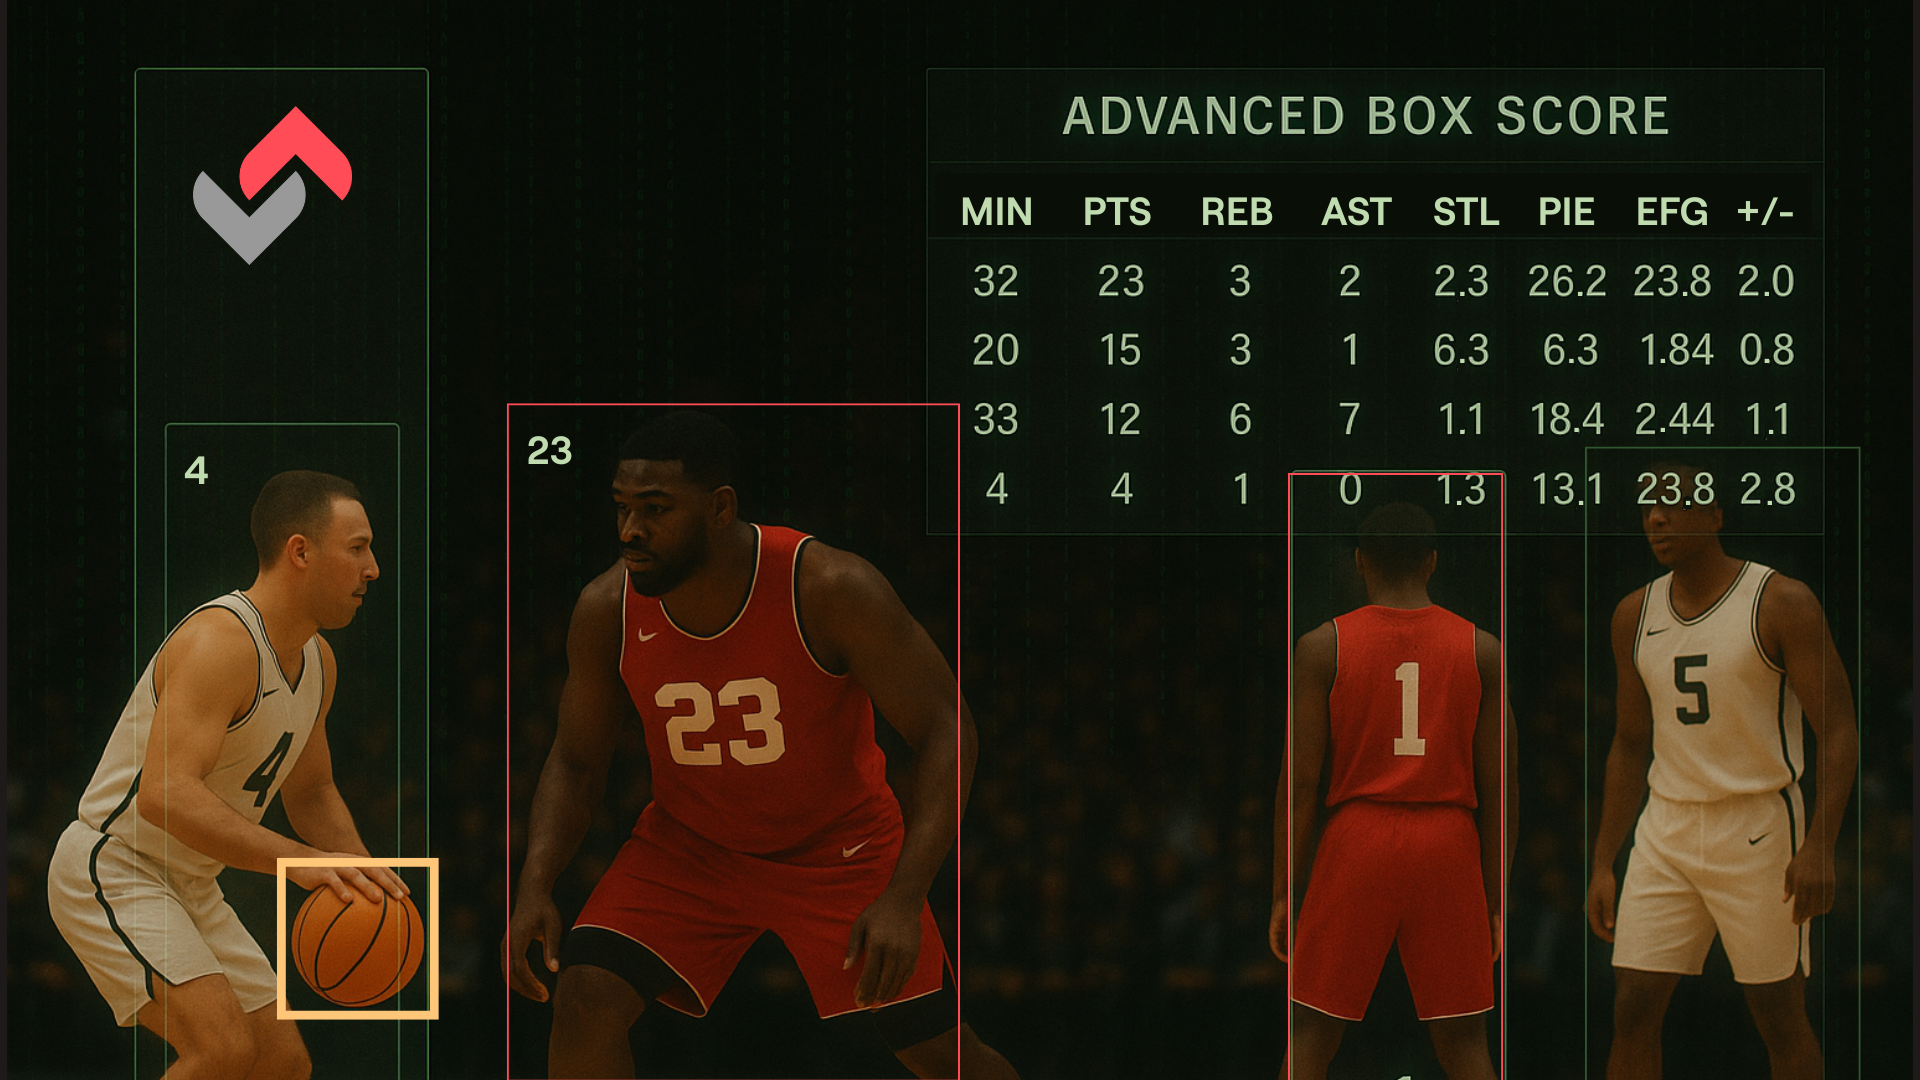
How to Interpret an Advanced Box Score
NBA statistics are essential tools for fans, coaches, and analysts, offering a lens through which we can evaluate player performance, game outcomes, and team strategies. Whether you're analyzing box scores after the game or diving into advanced data on your favorite player, understanding stats provides clarity and context to what’s happening on the hardwood. In this guide we’ll explore both the foundational and advanced aspects of basketball analytics to help you make sense of the numbers that shape the modern game.
We'll begin with traditional box score metrics, move through rate-based and advanced efficiency stats, examine plus/minus impacts, and wrap things up with tools, shot charts, and common analytical mistakes to avoid. By the end, you'll be equipped with a new statistical toolkit to enhance your basketball insights, whether you're breaking down your own game or studying the pros.
The Basics: Traditional Box-Score Metrics
Box scores have long been a snapshot of an NBA player’s performance. They display raw stats like Points (PTS), Rebounds (REB), Assists (AST), Steals (STL), Blocks (BLK), Turnovers (TO), and Personal Fouls (PF). These numbers are straightforward and are recorded in-game by official scorers. For example, a rebound is logged when a player gains possession after a missed shot, while an assist is credited when a pass directly results in a made basket.
While these stats are useful, they don't tell the full story. A player might score 25 points but take 30 shots to get there. Someone might grab 10 rebounds, but if their team allowed 20 offensive boards, did those rebounds really help? Additionally, traditional stats rarely consider efficiency, context, or defensive impact, which is why analytics have evolved beyond the box score.
Despite their limitations, box score metrics remain vital as a starting point for understanding performance. They're easy to digest and tell part of the story at a glance. Just remember: great stats in a vacuum can be misleading unless paired with context and deeper analysis.
Rate Statistics vs. Totals
Total stats, like a player's 2,000 points or 400 assists in a season, can be impressive, but they often reward time on the court rather than true impact. Rate stats, by contrast, offer normalized views of performance. Metrics like Points Per Game (PPG), Rebounds Per Game (RPG), or Assist-to-Turnover Ratio allow analysts to assess players on a level playing field, regardless of minutes or games played.
Per-36 or per-48-minute stats take this a step further. These metrics estimate a player's output if they played full starter minutes. For instance, if a bench player averages 10 points in 18 minutes, their per-36 might show 20 PPG, suggesting potential if given more playing time. Per-possession metrics, such as points per 100 possessions, are even more precise as they adjust for pace and opportunities.
These rate-based metrics are particularly important for comparing role players with stars or young developing players with veterans. They reveal efficiency, production per minute, and impact, beyond what aggregate totals can offer.
Advanced Metrics: Efficiency and Impact
Advanced metrics bring nuance into basketball evaluation. True Shooting Percentage (TS%) accounts for field goals, three-pointers, and free throws to measure overall scoring efficiency. It's calculated as: TS% = Points / (2 x (FGA + 0.44 x FTA)), giving a clearer idea of how efficiently someone scores across play types. Effective Field Goal Percentage (eFG%) adjusts for the added value of three-point shots, making it more accurate than simple FG%.
Player Efficiency Rating (PER), developed by John Hollinger, attempts to boil all box-score contributions into a single number, standardized so league average is 15. Usage Rate (USG%) reveals how much of the offense runs through a player while they’re on the court. It’s particularly helpful for understanding high-volume scorers or playmakers who may carry a significant offensive burden.
These metrics help distinguish between someone scoring 30 inefficiently and someone scoring 22 on fewer shots with better decision-making. In the modern NBA, efficiency is often more valued than raw volume, especially when winning is the goal.
Plus/Minus and On/Off Numbers
Plus/minus evaluates how a team performs when a specific player is on the floor. A +10 plus/minus means the team outscored the opponent by 10 points during the player’s minutes. While basic, this stat can highlight impact that might not show in box scores.
More refined versions include Box Plus/Minus (BPM), Real Plus/Minus (RPM), and Adjusted Plus/Minus (APM). BPM blends box score data with estimated impact. RPM and APM factor in teammate and opponent strength, providing a cleaner signal of a player’s individual value regardless of context. For instance, a player with high RPM may not score much but makes a huge impact on team success, think elite defenders or floor spacers.
However, these are best used with caution. Sample size, rotational matchups, and team schemes can skew results. Look for patterns over time rather than making judgments off small games or isolated situations.
Team Metrics and Pace
Team metrics provide insight at a macro level. Offensive Rating (points scored per 100 possessions) and Defensive Rating (points allowed per 100 possessions) are cornerstones of team analytics. Net Rating, the difference between them, shows overall team effectiveness. A team with an ORTG of 115 and DRTG of 110 has a NetRTG of +5, suggesting they outscore opponents by 5 points per 100 possessions.
Pace measures the number of possessions per game. A higher pace inflates raw stats but doesn’t necessarily indicate better performance. For instance, the 2023 Sacramento Kings led the league in pace and scored a ton - but efficiency metrics explain why their offense was elite, not just their speed. Conversely, a slower team like the Miami Heat may rank lower in points per game but be more efficient per possession.
When analyzing team stats, always account for pace. It changes how numbers should be viewed and gives depth to what might seem like underwhelming or dominant performances at first glance.
Contextualizing with Shot Charts and Tracking Data
Shot charts add visual context to efficiency. They show where players take and make their shots: at the rim, mid-range, or beyond the arc. For example, a player shooting 40% from three above the break but just 25% from the corners can adjust positioning to maximize output. Tools like heat maps quickly reveal scoring zones or cold spots.
Tracking data layers in details like speed, distance covered, contested shots, and rebounding opportunities. Instead of just knowing a player grabbed 10 boards, we can now see if they had 15 chances and how many were contested. This adds value to evaluating hustle, positioning, and opponent disruption.
Using a shot chart, a coach might redesign a play to get a shooter open in their hot zone rather than a low-efficiency area. These spatial analytics are key for both game planning and player development.
Common Pitfalls and Misinterpretations
One of the biggest traps is overvaluing counting stats without adjusting for context. A player averaging 25 PPG might be inefficient, while another averaging 15 PPG on fewer shots and better defense contributes more to wins. Always surround stats with usage rates, efficiency numbers, and team impact metrics.
Sample size issues are another concern. A player who shoots 60% over a week may not sustain that over a season. Garbage time stats also inflate numbers when games are out of reach and defenses relax. Additionally, comparing players across eras is tricky due to changes in pace, rules, and play style.
To navigate this, align comparisons by pace-adjusted stats, normalize values across league averages, and avoid reacting to small stretches of performance. Longevity, consistency, and adaptability all matter.
Closing it out
At SportsVisio, we believe in making advanced basketball data accessible, interactive, and impactful. Explore our platform to track player performance, visualize team trends, and go beyond the box score with real-time insights. The numbers are out there - start making them work for you.
Related Stories

.webp)

Get a Free Trial Game
Take SportsVisio for a test drive today.