.svg)
The Evolution of Basketball Stats: From Box Scores to Shot Signatures (2026)
Updated May, 2026 (Originally published February 2025)
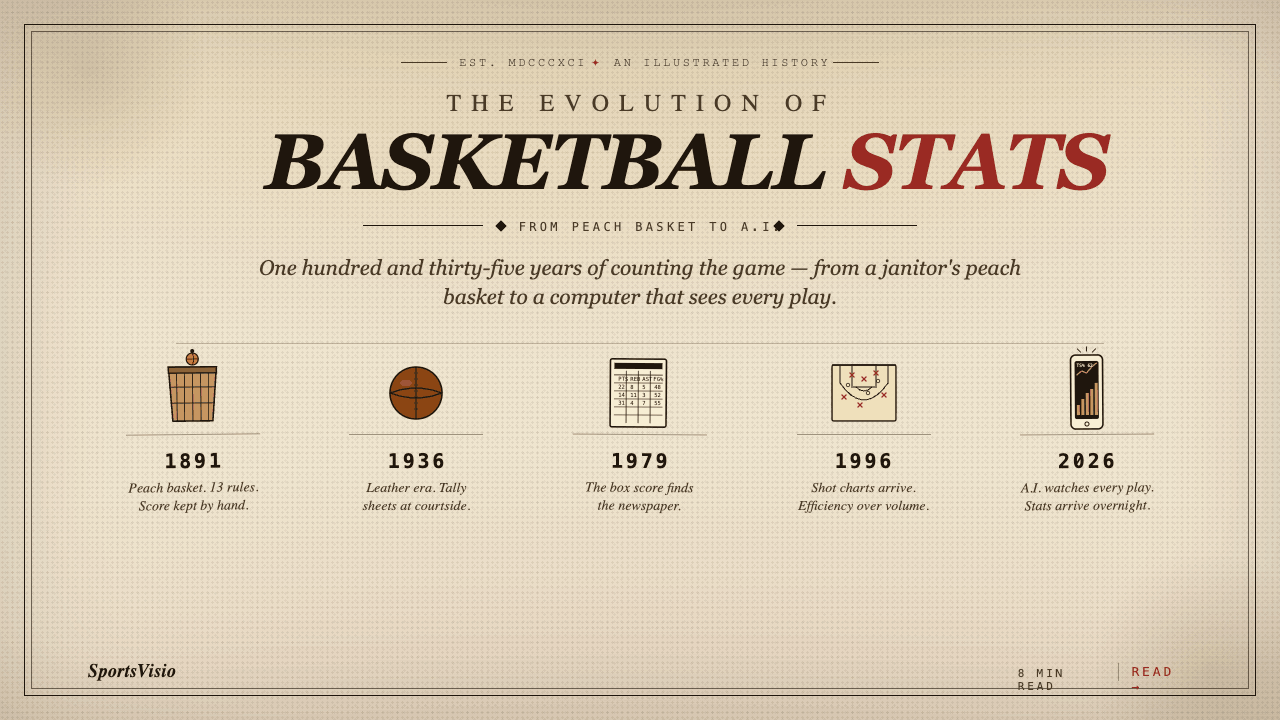
The first basketball game ever played, on December 21, 1891, ended 1-0. One basket. Twenty-seven total points scored across both teams in subsequent games that month. A single notebook held every relevant statistic from the entire sport.
Today, SportsVisio's database holds 59,227 individual basketball shots from a single year of league play across four leagues. Each shot is tagged with location, defender pressure, shot type, and outcome. We've used that dataset to identify five recurring shot signatures that describe how every player at every level actually scores.
That's the gap this article walks. One notebook to a dataset of 59,227 shots. Twenty-seven points across a month to AI shot signatures that predict winning lineups.
The story of basketball stats is the story of what we became able to see. Every era unlocked a new layer of the game that the era before couldn't measure. We're in the middle of another one right now.
The Early Days: Tracking the Basics (1891–1950s)
Basketball has always been a game of numbers, even when the numbers were almost nothing.
By the time the game moved to the pros in the 1940s, statistics were simple. While box scores were invented for baseball, the first basketball box scores included fundamental stats: field goals, free throws, and fouls. These numbers provided a snapshot of player performance but lacked any real insight into team efficiency or individual impact.
Stat recording was a completely manual process. Courtside statisticians jotted down plays by hand, and teams relied on these handwritten notes to understand basic performance metrics. Though rudimentary, these early stats played a significant role in shaping game strategy and player evaluation.
The first official box score recorded for the first NBA game (November 1, 1946, Toronto Huskies vs. New York Knicks) tracked 11 stats per player. The 1946 game had fewer measurable dimensions than a single SportsVisio possession in 2026.
The Expansion of Analytics (1980s–2010s)
Fast forward to the early 2000s. Sports had become a big business and compute power was becoming accessible. Baseball had gone Moneyball, and the sports analytics movement started to change how basketball stats were viewed. Inspired by baseball's lead, basketball analysts and teams sought to go beyond traditional box scores to uncover competitive advantages.
The 1981 Oakland A's didn't make the analytics revolution happen, but they made it cinematic. Basketball's version landed twenty years later. By the early 2000s, John Hollinger's Player Efficiency Rating and Dean Oliver's Four Factors had reframed evaluation around efficiency instead of volume. The NBA's own SportVU camera system, installed in every arena by 2013, turned every game into a stream of player and ball coordinates. The data existed. What didn't exist yet was the ability to capture the same data at any level below the NBA, on any phone, in any gym.
Suddenly, teams weren't just looking at who scored the most points. They were analyzing efficiency, contribution, and impact in new ways.
The Modern Era: AI Stat Capture Goes Universal (2020–Today)
Two things changed in the last five years that mattered more than anything in the 70 years before.
First, computer vision got cheap enough to run on consumer hardware. The same pipeline that powered NBA tracking systems in 2013 (camera arrays, dedicated servers, manual calibration per arena) now runs on a single phone propped against a railing in a high school gym.
Second, the models got accurate enough to trust. Made-shot detection crossed 95% accuracy around 2023. Player attribution crossed 90%. That was the floor required to make AI stats useful, not just interesting.
SportsVisio's pipeline runs eight specialized models in sequence: video normalization, court calibration, player and ball detection, identity tracking, possession segmentation, event classification, stat attribution, and highlight assembly. Each model catches the mistakes of the one before it. The output is a full box score, a shot chart, a possession log, and a highlight reel, delivered in the time it takes the team to drive home from the gym.
Jason Syversen, SportsVisio CEO, on the unlock: "We spent 70 years collecting basketball stats by hand because that was the only way. The interesting question is what becomes possible when collection costs go to zero. The answer is everything you couldn't justify measuring before. Possession-level efficiency at the youth level. Lineup chemistry in adult leagues. Shot signature analysis for any player who ever recorded a game."
What We Found in 59,227 Shots
In the 2025–2026 season alone, our system processed 59,227 individual shots across four leagues. We did something with that data that wasn't possible before: we asked whether every basketball player, regardless of league or skill level, fits into a small number of recurring shot patterns.
The answer is yes. Five patterns explained the majority of all 59,227 shots:
- Three-and-Rim: heavy three-point and at-rim volume, almost nothing between. The modern NBA archetype.
- Mid-Range Master: high efficiency inside the arc, lower three-point share.
- Paint Punisher: most shots within 5 feet, finishing volume over jump-shot polish.
- Spot-Up Specialist: high three-point share off the catch, low pull-up volume.
- Volume Slasher: drives that generate field-goal attempts and free throws more than catch-and-shoot looks.
The shot signature taxonomy is a 2026 unlock. It exists because the underlying data exists. Manual stat tracking could never produce a dataset large enough to support this kind of grouping at scale.
Moses Moody, NBA player and SportsVisio investor, on what this changes: "When I came up, the stat that decided your recruiting was points per game. Now coaches are starting to ask which shot signature you fit. That changes who gets recruited. A Spot-Up Specialist who isn't a top scorer is suddenly more valuable to a team built around a Volume Slasher than a higher-scoring Mid-Range Master would be. The data is starting to change the questions, not just the answers."
Read the full analysis: The 5 Basketball Shot Signatures.
What Comes Next
The next layer is already being built.
Possession-level prediction. Given the five players on the floor, the score, the shot clock, and the defensive matchup, what's the probability of each possession outcome? Pro teams are building this. The same models will land in college, high school, and club basketball within three years.
Biomechanics integration. Phone-based pose estimation is now accurate enough to flag shooting form irregularities and injury-risk movement patterns. Pairing that with the play-by-play context is the next compound move.
Real-time coaching feedback. The lag between a game ending and the coach having usable insight is now measured in hours. The lag between a play happening and the coach having usable insight will collapse to seconds.
Cross-game shot signature tracking for individuals. Five years from now, every active player will have a shot signature profile that updates after every game. Recruiters will sort by signature fit, not just by points per game.
The pattern of the last 130 years repeats. Each era saw the previous era's measurement limit lifted. We're in the middle of the next lift right now.
Frequently Asked Questions About the Evolution of Basketball Stats
When did basketball stats start being recorded?
Basketball stat recording began with the sport itself in 1891. The first formal box scores, modeled on baseball, tracked field goals, free throws, and fouls. NBA-grade stat tracking expanded through the 1940s and 50s with manual courtside statisticians, then through the 1980s and 2000s with composite efficiency metrics like Player Efficiency Rating and True Shooting Percentage.
What is the most important development in basketball statistics?
The single most important development in basketball statistics was the shift from raw volume metrics (points, rebounds) to efficiency metrics (true shooting percentage, points per possession) starting in the early 2000s. This change rewrote how players are valued and how lineups are built. The 2010s introduction of camera-based tracking and the 2020s arrival of consumer-grade AI stat capture extended that shift to every level of basketball, not just the NBA.
How has AI changed basketball analytics?
AI changed basketball analytics by making stat capture universal. Until around 2020, professional-grade stat tracking required dedicated camera systems, manual calibration, and human scorers. AI-powered systems like SportsVisio now process recorded game video from any phone and generate full box scores, shot charts, and possession-level data automatically. This made advanced analytics available to youth, high school, club, college, and adult-league teams for the first time.
What is a shot signature in basketball?
A shot signature is a recurring shot-distribution pattern that describes how a player tends to score. SportsVisio's 2026 analysis of 59,227 shots identified five common shot signatures across all levels of basketball: Three-and-Rim, Mid-Range Master, Paint Punisher, Spot-Up Specialist, and Volume Slasher. Shot signatures are a 2020s addition to basketball analytics enabled by AI-powered stat capture at scale.
How accurate are AI basketball stats compared to manual stat tracking?
AI basketball stats from systems like SportsVisio reach 95%+ accuracy on event detection (made shots, rebounds, fouls) and 92%+ on attribution to the correct player. Manual stat tracking by a trained scorer is highly accurate but limited by what one person can track in real time. AI captures categories (shot location, possession data, defender pressure) that manual tracking can't realistically cover.
What basketball stats matter most in 2026?
The basketball stats that matter most in 2026 are true shooting percentage (efficiency), assist-to-turnover ratio (decision quality), usage rate (offensive load), and net rating (team impact). Shot signature classification is now joining the list as a way to evaluate lineup fit. Traditional points-per-game remains the most cited stat but the least predictive of winning.
You're not watching the same game your grandfather watched.
Basketball didn't change. What we can see in basketball changed. The next era of analytics is being built right now on top of the proprietary datasets that AI stat capture made possible.
SportsVisio is where that data lives.
See what your team's data looks like →
Related Stories
.png)


Book a Demo and Get a Free Trial
Set up time to speak with our team and see our product in action.